Connecting JIRA and GitHub information
Our initial goal was to connect two data sources, JIRA and GitHub, and organize them in a data lake. Later on, the transformed data will be used to develop reports showing the dependency between the work of developers in GitHub and closed tickets in JIRA; Project Manager should see a dashboard of the team’s performance. After finishing this scope of work, we extended our data sources a couple of times:
First, we connected GitLab as an additional source to GitHub because some projects store code there, which gave us the ability to connect more projects to the dashboard.
Second, we connected the social sources, Twitter and Telegram. These were important in order to grab the necessary information for building an interactive map showing news with this message’s geographical location. To do that, we applied NLP (Natural Language Processing) to recognize the city name when it is mentioned and to map it to a geographical location. Also, we used Databricks auto-loader and streaming so as to decrease the time of when the data becomes available for analytics.
The result
We built a four-layer data lake to store raw and prepared data: Raw, Cleansed, Curated, and Laboratory. Laboratory is an extra layer that combines parts from the first three layers. It is used for self-analytics and Machine Learning. There are no specific rules for this layer, as the data is stored in different formats according to the business needs.
During development, we used different approaches to store and process data in the data lake. These aspects were involved:
- We avoided using a metadata file to determine which file was processed and which was not. We agreed to use two folders for processing, as we did not need extra metadata files. We just processed a file and moved it to the archive folder, where the raw layer stores data in the original format. Some pipelines rely on a built-in auto-loader functionality for tracking increments.
- We aligned the data format on the second layer and used the delta lake format for all sources. Using this, we were able to standardize all types of data and use a great feature of the data format that allowed us to track the history of changes.
- We stored combined data from our sources into one data model. We used the curated layer for consumption by the BI tool or application.
- We had one more temporary layer, laboratory, for different purposes, like applying experiments and giving access to the data science team.
- The data science team created various ML experiments, which were reproducible, and the MLFlow tool handled essential ML-ops processes.
For transformation logic, we used Python notebooks and ran them on the Databricks cluster. To track the execution of all the notebooks, we connected the Azure monitor, where we stored all the custom notifications. We had a dedicated notebook that saved logs, which we reused in other places. And for orchestration, we use Data Factory. Finally, to see if our processes were healthy and had no failed executions, we connected Power Bi directly to Azure Monitor and created a dashboard so as to see the system’s health. MLFlow capabilities were used for the ML processes performance metrics’ monitoring and models versioning.
What were the results of our work? We needed all these predefined rules and monitoring in order to achieve our goal. And lastly, we connected Power BI to visualize and see the connection between JIRA and Github (see Fig. 2).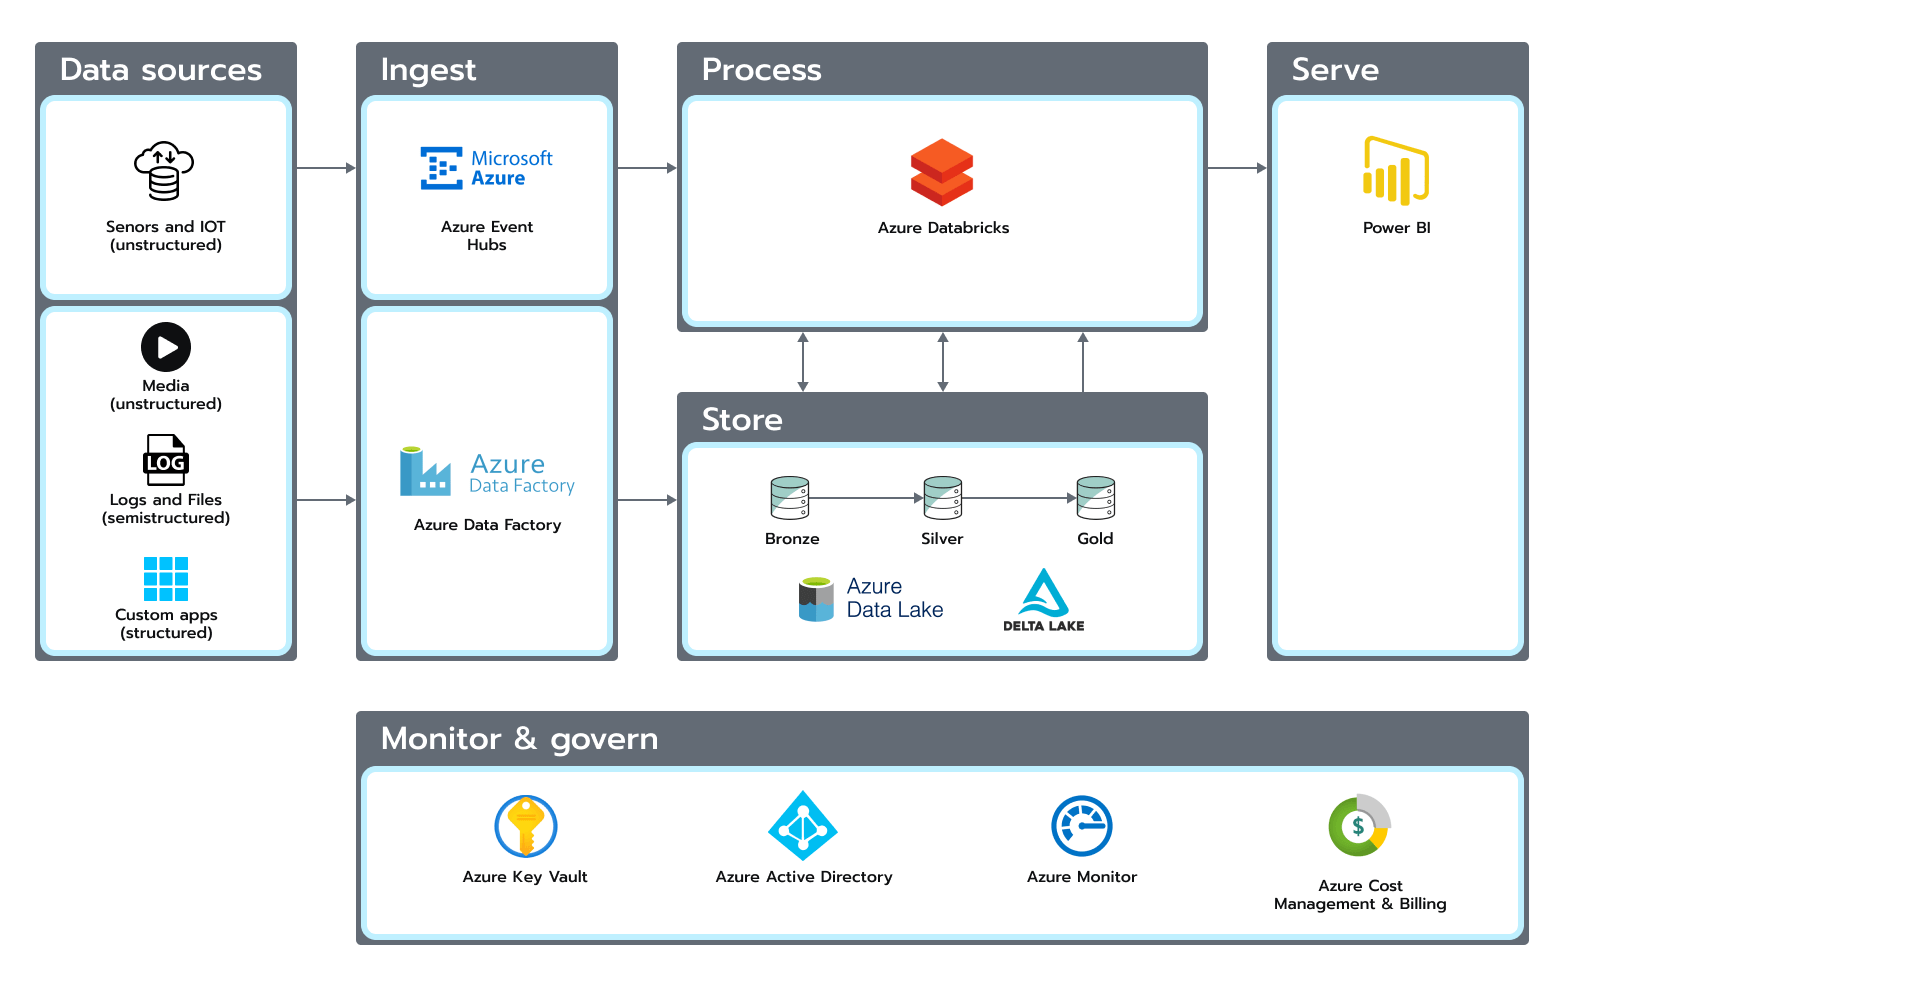 Figure 2. JIRA and Github connection
In the second iteration, we connected the social networks. Then, we grabbed the raw information and stored it in the raw layer of our architecture. Later, we transformed and kept it in the curated layer of the data model. Between these processes, we applied NLP in order to recognize the location mentioned in the message and extend our data model with geocoordinate attributes. Finally, we used the map to show news and historical mentions in a particular region in the identified country. Here you can see the results.
The bottom line
At first glance, the case above seems like an easy task. And with an appropriate architecture, achieving the results described above is possible. We also can extend our solution to meet new business needs, as each new case will have specific architecture requirements, use cases, and decisions. You can’t really just build an ideal one-time solution because each solution evolves and becomes stronger after several iterations.
Want to know more about how your data can handle a variety of business challenges? Our expert teams are ready to offer you the answers you might need. Contact us.


 Figure 1. Architecture based on the Azure Data ecosystem